Adobe (ADBE) — key metrics (June 5, 2026 close)
Price $251.44 | Market cap $101.6B | TTM and FY2025 data
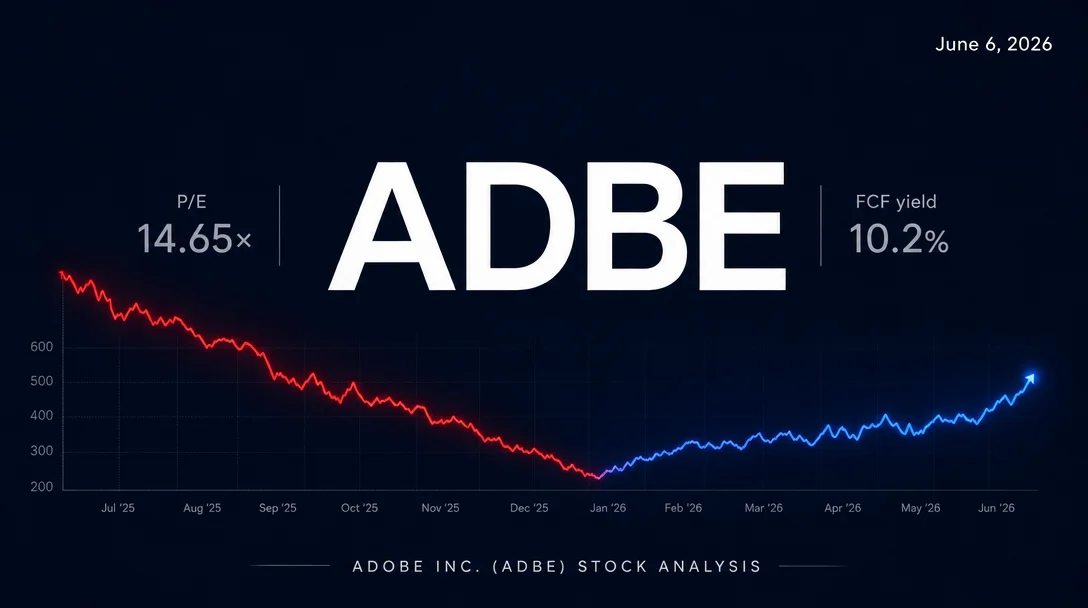
Adobe Inc. (NASDAQ: ADBE) passes all three hard screening criteria: ROE of 37.9% / 38.8% / 39.0% for FY2023–FY2025 (each year well above the 15% threshold), TTM FCF of $10.3 billion (FCF yield ~10.2%), and a trailing P/E of 14.65× — 64% below Adobe's own 5-year average and 50% below enterprise software peer median. The article covers all nine required areas and closes with a structured bull/bear framework anchored on the June 11 Q2 FY2026 earnings report.

| Fiscal year | Net income | Stockholders' equity (year-end) | ROE |
|---|---|---|---|
| FY2023 (ended Dec 1, 2023) | $6.887B | $18.168B | 37.9% ✓ |
| FY2024 (ended Nov 29, 2024) | $6.981B | $17.984B | 38.8% ✓ |
| FY2025 (ended Nov 28, 2025) | $7.171B | $18.398B | 39.0% ✓ |
| TTM (through Feb 28, 2026) | $7.208B | — | ~39% ✓ |
| Period | Operating CF | CapEx | FCF | FCF margin | FCF yield |
|---|---|---|---|---|---|
| FY2023 | $7.30B | $0.36B | $6.94B | 35.8% | — |
| FY2024 | $8.06B | $0.18B | $7.87B | 36.6% | — |
| FY2025 | $10.03B | $0.18B | $9.85B | 41.5% | — |
| TTM | $10.51B | $0.19B | $10.32B | 42.2% | ~10.2% |
| Company | Trailing P/E | Forward P/E | P/B | EV/EBITDA | PEG | One-line description |
|---|---|---|---|---|---|---|
| ADBE (Adobe) | 14.65× | 9.50× | 8.93× | 10.35× | 0.75× | Creative Cloud, Document Cloud, Experience Cloud — creative and enterprise digital software |
| MSFT (Microsoft) | 24.82× | 21.45× | 7.47× | 16.32× | 1.15× | Enterprise cloud (Azure), productivity software (Office 365), Windows, Xbox |
| ORCL (Oracle) | 38.36× | 26.66× | 18.32× | 25.78× | 1.25× | Enterprise database, cloud infrastructure, and business applications |
| ADSK (Autodesk) | 33.60× | 16.18× | 15.22× | 25.43× | 1.01× | Design and engineering software for architecture, construction, and manufacturing |
| CRM (Salesforce) | 21.49× | 11.95× | 4.44× | 13.91× | 0.94× | Cloud-based CRM platform; expanding into AI agents via Agentforce |
| NOW (ServiceNow) | 66.89× | 22.23× | 9.89× | 40.25× | 1.06× | Enterprise IT workflow automation; building AI-native autonomous workforce tools |
| Peer median | 29.28× | 20.06× | 8.68× | 20.88× | 1.09× | — |
| ADBE vs. median | −50.0% | −52.6% | +2.9% | −50.4% | −31.2% | — |
| Period | Revenue | YoY growth | Net income | Operating margin | Net margin |
|---|---|---|---|---|---|
| FY2021 | $15.79B | +22.7% | $4.82B | 36.8% | 30.6% |
| FY2022 | $17.61B | +11.5% | $4.76B | 34.6% | 27.0% |
| FY2023 | $19.41B | +10.2% | $5.43B | 34.3% | 28.0% |
| FY2024 | $21.51B | +10.8% | $5.56B | 31.4% | 25.9% |
| FY2025 | $23.77B | +10.5% | $7.13B | 36.6% | 30.0% |
| TTM (Feb 2026) | $24.45B | +11.0% | $7.21B | 36.7% | 29.5% |
| Q1 FY2026 (quarter) | $6.40B | +12.0% | $1.89B | 37.8% | 29.5% |
| Metric | FY2025 | TTM (Feb 2026) |
|---|---|---|
| Total debt | $6.65B | $6.66B |
| Cash & equivalents | $6.89B | $6.89B |
| Net debt / net cash | Net debt ~$0.0B | Net cash ~$0.23B |
| Debt / equity (D/E) | 57.2% | 58.2% |
| Interest coverage (EBIT / interest) | 33.1× | 33.9× |
| Current ratio | 1.00 | 0.91 |
| S&P credit rating | A+ (Stable) | — |
| Moody's credit rating | A2 (Stable) | — |
Add more perspectives or context around this Post.